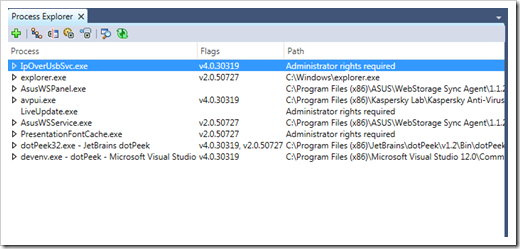
dotPeek introduces Process Explorer, decompile running .Net apps, in v1.2 EAP
JetBrains .NET Tools Blog - dotPeek 1.2 EAP: Introducing Process Explorer
"Have you ever wanted to dig deeper into a process running on your machine? We have. That’s the reason why the new dotPeek 1.2 EAP build introduces Process Explorer.
The Process Explorer window provides you with the list of all currently running processes and allows decompiling those of them that are .NET processes. Once you locate a process to decompile, you can add it to Assembly Explorer for further investigation by clicking the “+” button. From there, you can export decompiled code to a Visual Studio project if necessary.
You can see native processes in this window as well although you naturally shouldn’t expect dotPeek to be able to decompile them. To display native processes, click Show Native Processes in the Process Explorer toolbar
...
In case you’ve missed it, note that dotPeek 1.2 EAP can now work as a symbol server and supply Visual Studio debugger with the information required to debug assembly code. Download dotPeek 1.2 EAP and give it a try"
That's scary cool...
On an aside, I wonder if this isn't another reason to be interested in .Net Native Compile when releasing commercial apps? Native speed and a much harder time decompiling.... hum.
Related Past Post XRef:
"Hello dotPeek plugin" Creating a dotPeek plugin is New Project, NuGet easy...
And there were three free RTW'd .Net Decompilers ... dotPeek v1 Released
Another decompiler comes online - dotPeek from JetBrains


No comments:
Post a Comment